Recently I read a news article about two mothers who were arrested on their property as a result of them blocking access to their utility meters in order to prevent the utility company from replacing their analogue utility meter with a digital "smart meter". The mothers are members of the Naperville Smart Meter Awareness group (NSMA), and NSMA has a federal lawsuit pending against the City of Naperville regarding the installation of the smart meters in the city. NSMA is concerned that the smart meters will affect health, security and privacy. NSMA also objects to the Naperville Department of Public Utilities referencing a document created by the California Council on Science and Technology (CCST) titled "Health Impacts of RadioFrequency from Smart Meters" as evidence that smart meters pose no threat to public health. They claim that the CCST document has numerous flaws and does not address whether the current FCC
guidelines are sufficiently protective of health considering current levels of RF exposure (which includes ambient
levels from other devices), and the cumulative effect over time. The NSMA group also cites nuclear physicist Daniel Hirsch's commentary on the CCST data as an indicator that the smart meter radiation levels could be 100 times more exposure than cell phones.
I began to do some research, starting with looking up the FCC ID of our smart meter [FCC ID: R7PER1R1S4]. The information I found states it is made by Landis+Gyr and is called the Focus-2. The data that I found on the L&G Focus-2 unit via the FCC testing data states the average RF output power is ~16dBm (which is equivalent to 40mW) when operating in the 902.1-927.9MHz frequencies. The L&G Focus-2 UtiliNet endpoint has an integrated loop antenna, located on the PCB surface layer on the reverse (non-component) side of the assembly. According to the FCC test report, the antenna has a typical gain of ~3dBi. From the UtiliNet Endpoint User Guide:
UtiliNet is a comprehensive wireless data communications solution that utilizes spread-spectrum radios in the 902-928 MHz area of the radio spectrum to provide reliable network answers for remote telemetry or distributed control applications. UtiliNet radios combine three important technologies: a mesh architecture for peer-to-peer communications and true networking functionality, asynchronous spread spectrum frequency hopping for maximum use of bandwidth, and packet switching for guaranteed message transfer and automatic store-and-forward routing.
The communication language/protocol used between the UtiliNet smart meters (mesh nodes) is the Device Control Word (DCW) language. Typical application information requests are radio configurations, radio queries, data collection, communication to end devices, protocol translation and peer-to-peer control.
I did my own research to verify the data for whole body SAR being used in these reports. Sometimes the SAR value was expressed in microwatts (μW/cm2), other times it was expressed in watts (W/cm2). Luckily there's a couple of handy websites that'll do the conversion for you. Microwatts to Watts and Watts to Microwatts. The CCST report contains the following chart showing the values they've used to calculate the threat level of the smart meter radiation output:
I have a few issues with the wording and the data used in Mr. Hirsch's report. These following two paragraphs precede the chart above in his report and the wording used strongly suggests his chart is not using definitive values.
It is strongly recommended that CCST revise its Draft Report and conduct actual
measurements of cell phone, microwave oven, and SmartMeter RF cumulative whole body
power densities. If measurements aren’t made, then rigorous calculations correcting for cell
phone and microwave oven duty cycles and whole body exposures should be made.
A summary figure below shows how rough estimates of the effect of those corrections
suggest SmartMeters may produce cumulative whole body exposures far higher than that of cell
phones or microwave ovens.
His repeated use of qualifying words (summary, rough, suggest, may) gives the impression that he is not making a definitive conclusion with the data being displayed in the chart. The problem I have with this is that Mr. Hirsch's chart is being used as factual evidence to the risk of exposure to smart meters. I took it upon myself to find neutral Internet sources documenting the radiation output for microwaves, the L&G Focus-2 smart meter (since this is the one installed outside my residence), the iPhone 5, Samsung GT-I9500 and the FCC limits for RF exposure. Below is the chart I've compiled presented on the left in microwatts and on the right in watts.
Here are the links to the sources I used for the data represented in my chart shown above: iPhone 5 radiation testing1.18W/cm2 Samsung GT-I9500 radiation testing1.55W/cm2 L&G Focus-2 smart meter.000018W/cm2 Maximum microwave oven leakage data.0000005W/cm2 FCC limits for RF exposure (FCC 13-39 3/29/2013) .08W/cm2 - 1.6W/cm2 Mr. Hirsch also expressed concern that the duty cycle of the smart meters wasn't represented accurately in the CCST report. His report assumes a 100% transmit duty cycle for the smart meter output (that is to say that the smart meter is transmitting/generating signal 100% of the time). As I began to read about the L&G Focus-2 smart meter installed where I live, I realized I could use the Metageek WiSpy 900x to view the frequencies the smart meter operates (902-928 MHz). I made a few recordings indoors and outdoors in hopes of picking up the transmissions from the smart meter. I wanted to see if I could ascertain how often the smart meter was transmitting, and for how long. In this video clip, I start off with the outdoors recording. I was positioned at a distance of 6 inches from the plastic cover to the smart meter. There were intermittent bursts of RF energy detected, but there did not seem to be a predictable, repeatable pattern to the transmissions. The second half of the video is the recording that was taken indoors, approximately 10 feet from the wall where the smart meter is installed. The RF energy detected indoors was not as strong as the signals picked up when positioned closer to the smart meter.
The RF energy bursts detected by the Metageek Wi-Spy 900x were very brief and did not use up a large portion of the available spectrum. Duty cycle utilization was minimal, given the short transmission windows. It is clear that the L&G Focus-2 is continually powered on with electricity, but that the smart meter is not transmitting continuously, nor is it utilizing a 100% duty cycle. The videos page of the Naperville Smart Meter Awareness website features an Infowars segment where one of the ladies who was arrested for attempting to prevent the installation of the smart meter on her home is interviewed.
There are a lot of statements made in this video that I take issue with, but I'll keep this post focused on smart meters. This Infowars video segment references this article from Watchdog News Daily titled "Health Hazards Linked To Utility Meters". Personally, I'm dubious of any news site with pop-under advertisements, but I'll let it slide this time for sake of research.
Joe Esposito from Owasso, Okla., had a smart meter installed on his home in 2011 as part of a pilot program developed by the Public Service Company of Oklahoma. Even though he asked that a meter not be installed on his home, Esposito found one mounted on the side of his house when he came home from work.
It was then his health problems started. Esposito started experiencing dental problems, from aching teeth to a constant tingling sensation. He also started to experience aches in his leg which only got worse at night.
After watching a video titled “Smart Meters & EMR: The Health Crisis of Our Time” by Dr. Dietrich Klinghardt, Esposito followed the advice in the video and installed some lead sheeting around the meter on the outside of his house. The results were dramatic. He had the first good night’s sleep in months and the pain in his leg was gone. Additional protection inside the home added later gave relief from many of his other symptoms. As an experiment, he would sometimes sleep without the protection and his pains would return.
Dr. Klinghard makes the case that the increase in chronic medical conditions is related to the increasing electromagnetic radiation exposure (at the 6 minute mark in the video), he then takes his correlation to using the estimated number of wireless subscribers and comparing those numbers to the rise in Autism statistics. Correlation does not indicate causation, and I caution everyone to dig a little deeper when absolute statements are made with little regard for documenting information sources. It would appear that Dr. Klinghard has a vested interest in finding EMF exposure as the cause for multiple health symptoms as his personal website sells products that claim to reduce your exposure to EMF radiation.
At this point I'm stopping my research into the FUD that is out there about smart meters. I could go down this rabbit hole for untold iterations and still get back to the same conclusion I made several paragraphs ago. The data I gathered clearly indicates that the RF output of smart meters (at least the L&G Focus-2 meter) is well below the FCC limitations and does not use 100% of the duty cycle when the smart meter is transmitting. I saw nothing in the spectrum analysis capture I performed that caused me to be concerned about the RF energy being transmitted by the smart meter installed at my residence. If you're wondering what your smart meter is or isn't doing, you can see it for yourself with a Metageek Wi-Spy 900x. P.S. I wish that Dr. Klinghard would say how much data I could store on his Computer Harmonizer K. Dwell Stick. For just a few dollars more, I can get a Kingston 128GB USB 3.0 Data Traveler on Amazon. The Kingston might even work as a noise filter or a protective pendant, but I'm sure of one thing it'll do - store a lot of data.
Sanjit Biswas opened for the Meraki portion of Wireless Field Day 4. He told us that Meraki is still hiring and has started construction on a new office. At the time of the recording it had been only 45 days since the acquisition. Meraki is continuing to develop their product line, there are a variety of devices in the pipeline. The hardware development cycle is very long so it will be some time before there are Meraki/Cisco created APs. As a result of the acquisition, Meraki is now able to go International to Asia Pacific and other parts of Europe where they did not have a presence (previously Meraki was only in the UK and Ireland markets). Meraki is investing in adding richer features and their System Manager has been installed on about one million devices so far.
Sean Rhea took us behind the covers on Meraki's Dashboard. He has a PhD in distributed systems from UC Berkley and joined Meraki in 11/07.
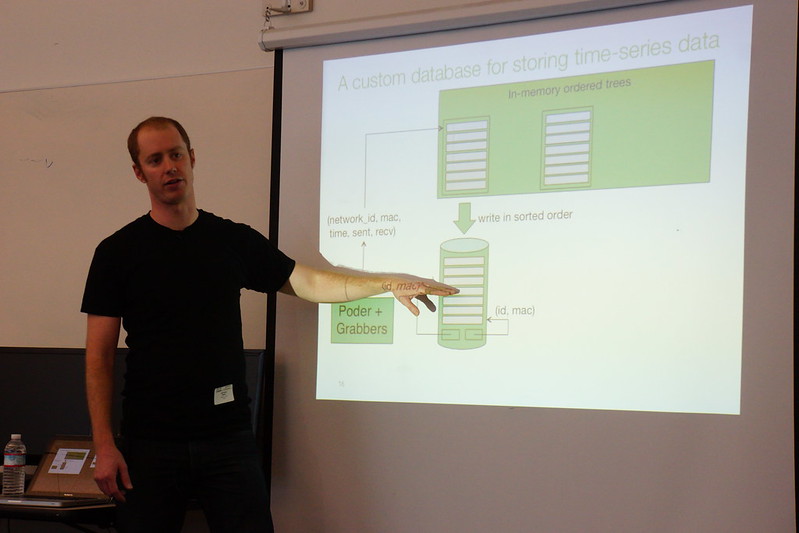
Meraki (now part of Cisco) Cloud Architecture Deep Dive with Sean Rhea from Stephen Foskett on Vimeo. Meraki customers partitioned across different servers, on different shards. This server is effectively a 1u raided server plus 1u backup (in a completely different data center/provider). One of the shards acts is the master and acts as a demultiplexer. Thousands of Meraki devices connect to a shard. 100s of 1000s devices checking in per day 300GB of stats dating back over a year New data is gathered from devices every 45 seconds. If you are actively viewing the device in Dashboard it's every 1 second. Engineering challenges are how to get access to devices behind NATs. The Meraki system mtunnel allows them to talk to their devices even if they're behind a NAT. The tunnel is fully encrypted and the information sent over the tunnel is SSL. Mtunnel is used across the entire Meraki hardware platform. This custom secure tunnel requires only 2 packets/device/25 sec It looks like ipsec, but is not point to point may route from a shard to a shard Devices talk ssl over the tunnel. Each ap ships with a certificate with the shared secret on it. The backend infrastructure is the same across switches and systems manager platforms. Another problem is how to gather this information and minimize network overhead for Meraki & the customers and minimize the cpu costs for Meraki. Meraki has developed a custom database tuned for statistical data. They achieve SSD-like speeds from inexpensive spinning hard disks. Poder is a relatively new system at Meraki, first developed in 2009, then fully revampd in 2011. The idea is to gather stats from hundreds of thousands of client devices via the devices' internal web server. The naive approach • Overview • Each device runs a small web server • each shard runs one grabber daemon per statistic type (usage syslogs uptime etc) • grabber fetches stats from devices as XML over HTTP. Implementation • 1 process per grabber, N+2 threads per process • 1 thread to query DB for new devices to fetch from • N threads to perform blocking HTTP fetches from devices • 1 thread to insert fetch results into DB Naive approach pros and cons • TCP easily carries arbitrarily large responses • Becomes expensive at scale • A single HTTP fetch to empty webpage = 10 packets and 510 bytes • Every grabber does its own fetch, no sharing connections • Lots of threads for I/O parallelism = lots of context switches • Limited to 1 fetch/node every 10 minutes. A high-performance approach (4th gen) • The first thing they created was an event driven RPC engine • Non blocking IO, talks to 10k devices in 20 sec • Uses UDP and Google protocol buffers (binary encoding format) (greatly reduces packet size) • Stats are obtained through different modules lldp modules (each has it's own thread) • Database is read from by each of the different grabbers Example: probing clients module/lldp module A request object is passed through each of the modules, info requests are appended to request sent to the AP. Requests sent to APs often look different than switches due to the different functions that are done by different hardware. The modules are single-threaded, block on DB access and most are 200-400 lines of straight-line Scala code. There are no locking or synchronization issues to worry about. Poder aggregates requests and responses for different modules. Overhead is a minimum of 2 packets/48 bytes for an empty response (80-90% less than previous Poder versions). Now Poder can fetch data every 45 seconds. What to do with the data? Where to store it and how to get it back out to display? The storage cost of all the data that can be collected can be averaged out at 3600 clients (10 apps) (3 records per hour) 72bytes per record = 63gb per year. Your standard OLTP databases (Postgres, MySQL)are not very good at clustering. Unless your working set fits in RAM queries take many seeks. A standard seek can take up to 18 minutes on a traditional hard drive to draw the overview dashboard graph. With the custom database they've created (Little Table) it takes 2 seconds to draw (100mbs a second). Data can't be aggregated because aggregation discards useful information. The peaks can be averaged into data and no longer shows as severe/peaks. Queries are written in order, writes footers with network_id and macs and are flushed every 10 minutes for durability (power outages) APs have statistics stored locally and can be queried again when the system comes back up. The files are merged and stored back to disk (in order) after 28 days (even multiple of seven to make the merge of data 'nice'). Max file size is 2GB to avoid messing with 64bit file pointers. The Meraki data when it is on a Meraki server, it is unencrypted for speed. The data centers where their data is kept meets SAS 70 requirements. When the data is stored offsite for tertiary redundancy, the data is encrypted.
In my opinion, the Meraki presentation about their fine tuned database was the most technically interesting video of all of the presentations we watched during WFD4. I have very limited knowledge of database structures or data storage methods, but Sean held my attention and I think I almost understood what he was describing. Watch the video and see what you think.
I was an early backer of the Lomography Smartphone Film Scanner Kickstarter project. The scanner arrived a few weeks ago, but I'd been waiting to open it until the Lomography Scanner app was available via the iPhone app store. Well, the app was finally released yesterday, so today I opened it all up and gave it a whirl.
The film scanner is a little plastic gizmo that has a backlit lightbox at the base of the scanner (two AA batteries not included), several plastic expansion stackers (in order to adjust the closeness/focus of your smartphone camera) and an adjustable holder for your smartphone at the top. It also comes with a little foam shim to keep your phone level against the opening to the lightbox.
Your first choice is to select regular, lomokino or panoramic for your negative type. Then the scanner app gives you several options for the images you're scanning in: NONE, NEG, B&W, SLIDE, XPRO and REDS. It's not entirely clear what the negative settings are for and there isn't any context help built into the first release of the scanner application. I chose B&W for my negatives, but perhaps I should've chosen NEG. It's hard to discern the difference between the two settings. There aren't any separate controls for white balance or exposure. I was able to adjust the white balance by touching opposite corners of the image before taking the photo, but it was hit or miss at best.
I couldn't find my shoebox of negatives, so I used some black and white negatives from my community college photo class (circa 1992). Making a print of every image I shot wasn't feasible at the time. Firstly due to the cost of the photo paper and secondly, not every image on the roll was good enough to print. Below is a slideshow of a few selected images I scanned in. There's one of Salt 'n' Pepa from the 1992 Inauguration festivities, a couple of self portraits, a sequence taken for a photo class project called "Portrait of Self Without Self", and a few of my first car (a 1964 Plymouth Barracuda).
The scanner device is pretty cool, even if it the smartphone app could use a little help. Now if only I could remember where I stashed that shoebox of negatives...